Dashboard
One page to explore a database: every road and layer, a side panel to filter, colour and inspect.
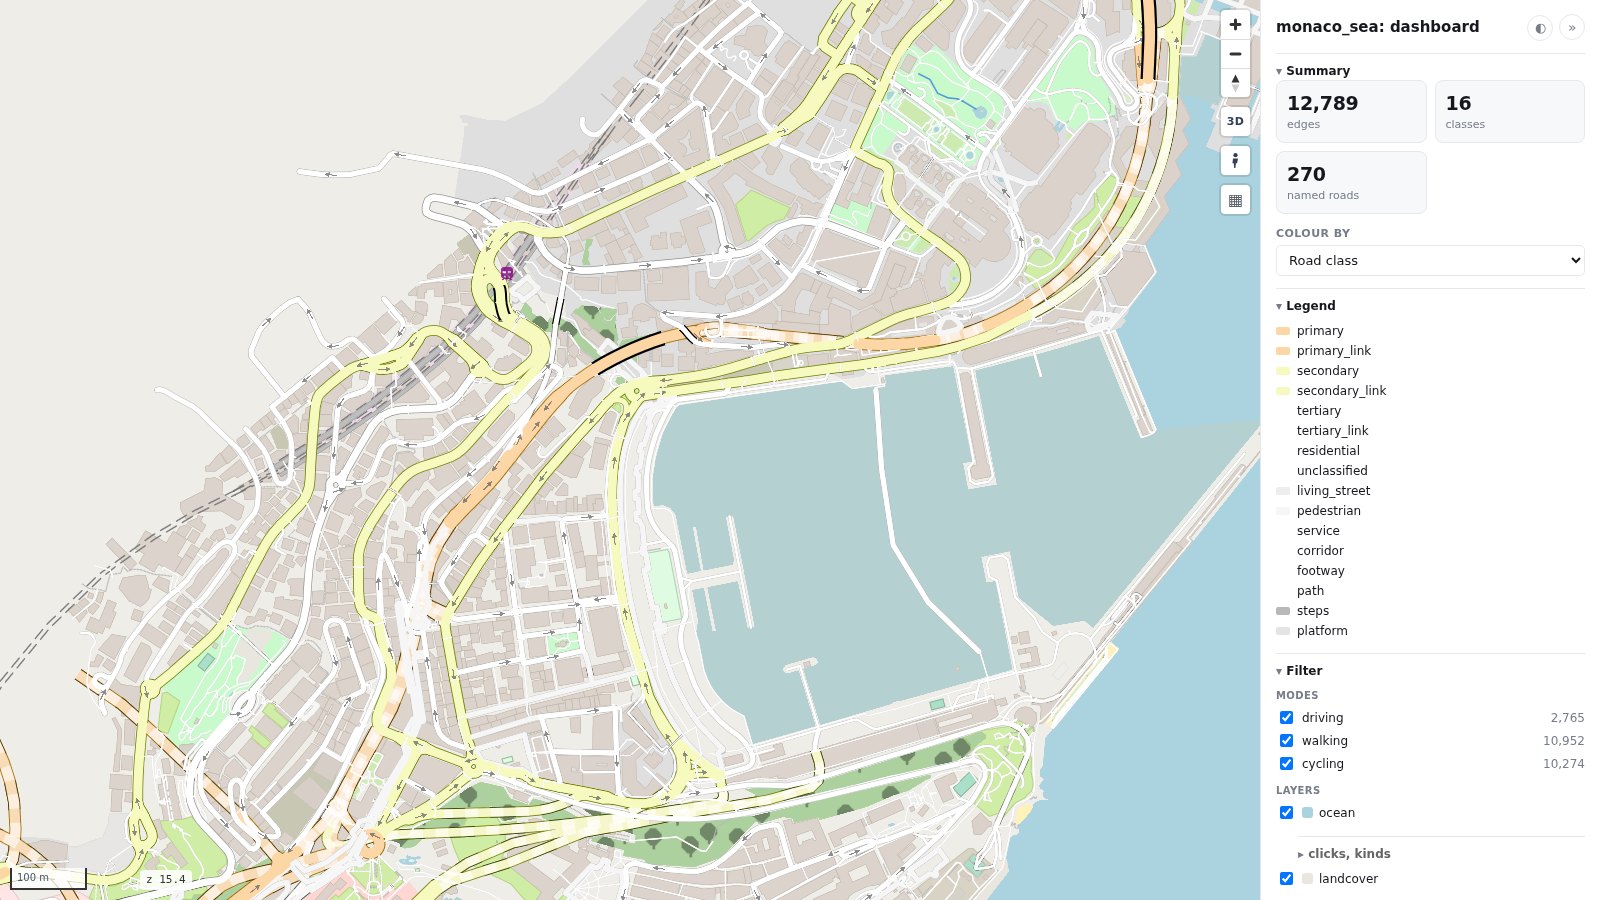
The side panel
- Summary: how many roads, classes and features are on the map.
- Colour by road class, or by mode: which modes can use each road (all modes, driving + walking, walking only, …), with a legend (when colouring by class, the Road type list below is the legend).
- Filter, in cards: Roads (mode, private roads and bus lanes, and road type), then the layers
grouped by meaning (Nature and water, Buildings and places, Transport), each with
all/none. - Per layer, the ⚙: make it clickable or not, turn its hover tooltip and click popup on or off, and show only some of its kinds (just parks, say).
- Search, and the fields of whatever you clicked: a road, or a feature and the roads under it.
The panel is roadstyle's report page (roadstyle.render_report); mapstyle adds the mode filter, the
mode colouring and the per-layer switches. Each is a JavaScript call
too, so your own page can drive the same filters.