Dashboard layout
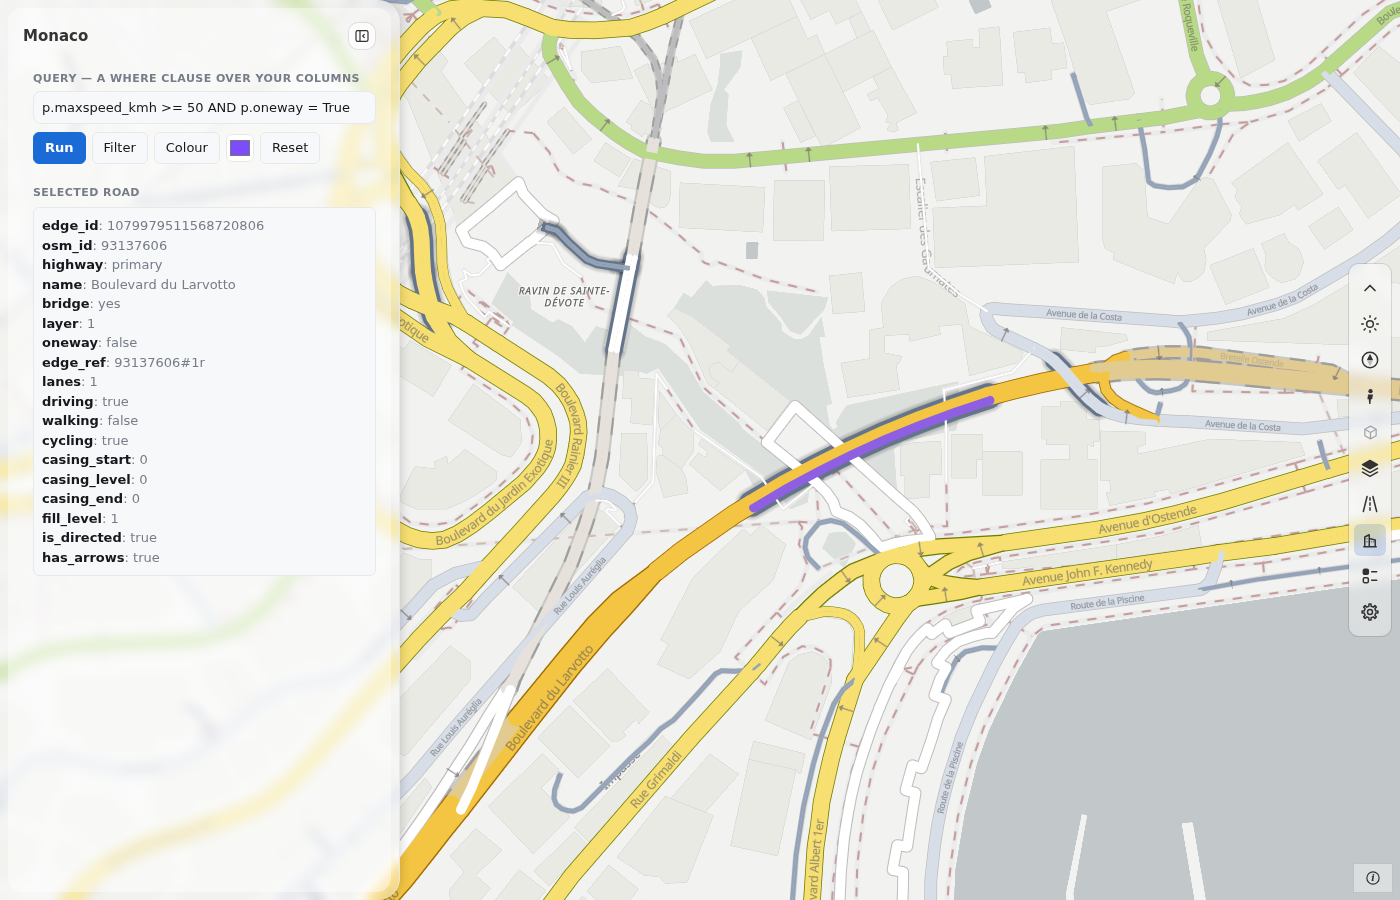
A dashboard is a map with a toolbox and a side panel (Dashboards). This page describes the frame and the toolbox: the layouts, the panel frame, each tool, the windows, the dark theme and the phone form. The panel is at the left and the toolbox is at the right edge. The panel is empty, and there is no scale box.
import roadstyle as rs

rs.render_dashboard(edges, color_options={"Road class": {}}).save("dashboard.html")
The form
There is one template with a panel: dashboard. layout changes the frame:
| Keyword | What you get |
|---|---|
layout="overlay" (default) |
The map fills the window. The panel floats over it, at the left. The toolbox is a column at the right edge (dashboard={"toolbar": {"position": "left"}} moves it); its boxes open to its left |
layout="dock" |
The panel is docked at the left and takes its own space. No toolbox: the tools are the MapLibre buttons |
template="map" is the map only (the default of render_edges). The classic template and the report page are gone.
dashboard={...} changes any option of the template. Every key, with its default, is in Dashboard options.
The panel
The panel has a frame: the title (the page's name), the theme button and the hide button. The sections that the page adds are in Add to the panel. The options side, look and width_px set the edge, the look ("frame" or "card") and the width. The person can change the edge and the look in the settings.
The title stays, and only the body scrolls. The scrollbar is at the outer edge of the panel: at the left of a left panel, at the right of a right panel. It shows only when you point at the panel or scroll. A soft fade at the bottom edge shows that more content is below. The scrollbar has a contrast of 3:1 or more in both themes. The sections of the page scroll with the rest, and you do not need CSS for it.
If you must change the text of the template, build the page and change m.html. The panel is <div id="sb">, and its sections go in <div class="sb-body">. These ids of its frame stay stable: sb-hide, sb-show and sb-th.
The toolbox
The bar has one button for each tool, in this order: theme, navigate, Street View, Google 3D, base map, roads, 3D buildings,
colour and legend, settings, credits. The toolbox is fixed. A tool that the page cannot use stays in its place, greyed out, and its
tooltip says why. For example, Google 3D is grey when google_3d is off, and the 3D buildings tool is grey when the base map is not
a vector map. rs.tools.list() gives each tool with its disabled state.
A box opens toward the map. One box is open at a time. A click outside it, or Escape, closes it. A box stays inside the window.
Navigate
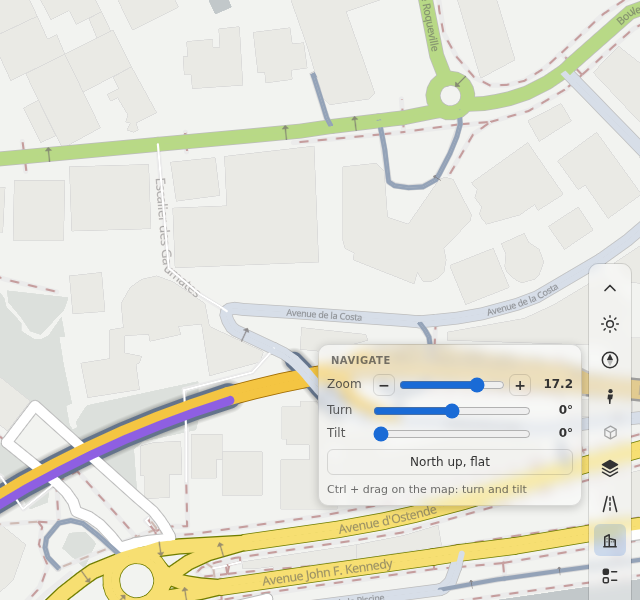
One button (the compass needle) replaces the zoom buttons, the compass and the 2D/3D button. A click opens a box with a zoom slider (with - and +), a turn slider, a tilt slider and the button North up, flat. Ctrl + drag on the map turns and tilts it. The needle turns with the map and flattens with the tilt.
dashboard={"toolbar": {"navigation": "buttons"}} brings the earlier buttons back: +, -, the compass and 2D/3D. Dragging the compass
turns the map (left and right) and tilts it (up and down). A click on it sets north and the tilt back.
Roads
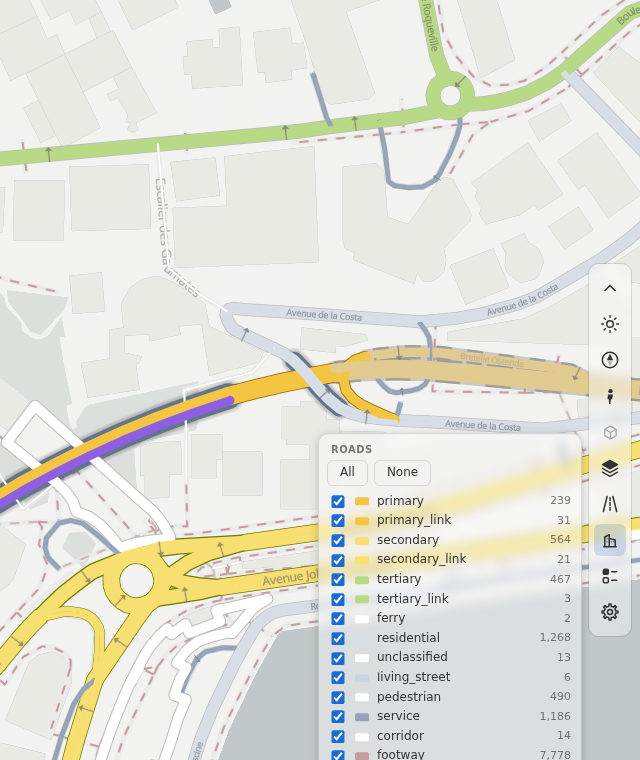
The roads tool is the road filter. The box has a row for each road class, with a check box, its colour, its name and its number
of roads. All and None set every row. A click on a name shows only that class. A page with bridges, tunnels or access kinds
(access_col) has a row for each of them too. The tool uses the same calls as rsSetClasses, rsSetBridges, rsSetTunnels and
rsSetAccess, so a script and the tool use one filter. When a page has no road classes, the tool is grey. A style that comes later
(rs.setStyle) brings its own classes.
Base map
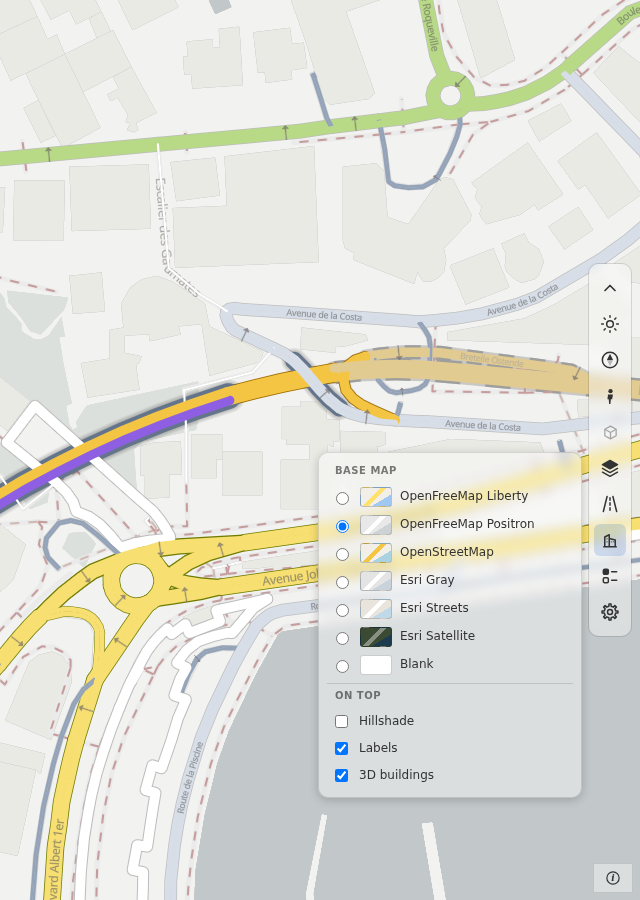
The base-map tool lists the base maps that need no key: OpenFreeMap Liberty and Positron, OpenStreetMap, Esri Gray, Esri Streets,
Esri Satellite and Blank. Under On top it has three switches: Hillshade, Labels and 3D buildings. A page can offer other base maps with basemaps=.
When the style has base-map layers of its own (the duckOSM layers: land cover, water, buildings and more), the box has one more
switch for all of them. Its label is Map layers (overlays_label). The legend box lists the same layers, each with its colour. The
swatch has a thin border, so that a white colour shows.
The 3D buildings switch tilts a flat map to 55° and zooms in to 15 when the zoom is under 14.5, because the buildings start at that
zoom. When you switch it off, the map goes flat again if this switch tilted it. A call of rsBuildings(on) from a script moves nothing.
Colour and legend
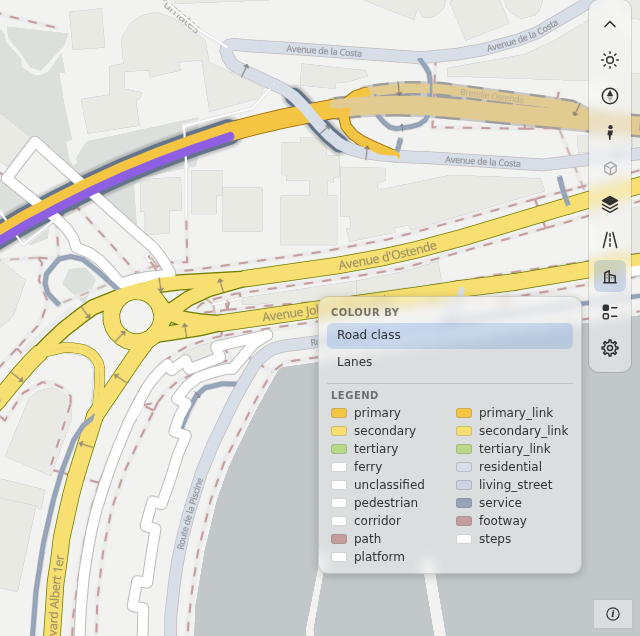
The box has the Colour by list and the legend of the active colour option. Your own rows follow the legend:
rs.render_dashboard(edges, dashboard={"legend": {"rows": [
    {"color": "#ff0066", "label": "Events"},
    {"color": "#16a34a", "label": "Sensors", "shape": "circle"},
]}})
rs.legend.add adds a row from JavaScript. A row has a color, a label and a shape (square, circle or line). The shape tells the reader what the color is on the map: a line for a road, a circle for a sensor. A page with
live data lists each set of numbers with its range and its number of roads. rs.colorModes gives the box a "Colour by" list of your
own. The tool is grey when the page has no colour option and no live data.
Settings
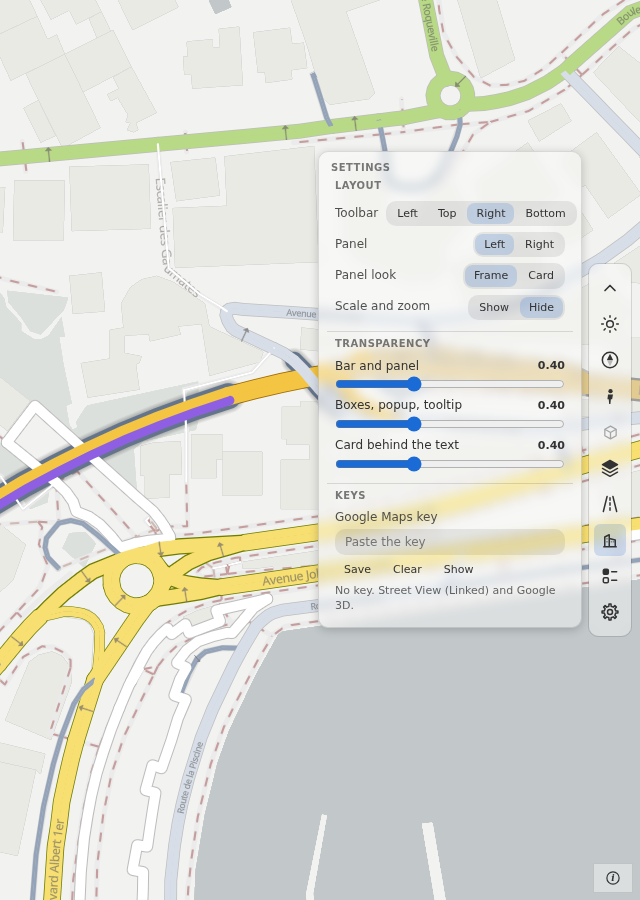
The gear button opens the settings. The browser keeps them. They do not go into the page file.
- Layout. The bar: left, top, right or bottom. The panel: left or right, as a frame (default) or a card. The scale and zoom number can show.
- Transparency. Three sliders: the bar and the panel, the boxes with the popup and the tooltip, and the card behind the text. Every floating part follows one of the three sliders. The bar and the boxes start at 40 %, the card behind the text at 70 %.
- Keys. A Google Maps key (Street View, Google 3D). No base map needs a key. A saved key replaces the key of the page. A page needs no Google key at build time.
Credits
The credits button is in a box in the bottom corner of the map, on the side opposite to the panel. With the bar at the right, the box is at the bottom right, below the end of the bar. The scale and the zoom number are
in the same box, and the person chooses to show them. The box is always shown. On a phone the credits button is in the bar.
The credits list starts with the credits of your page. The dashboard has "© OpenStreetMap contributors", the source of its roads.
dashboard={"credits": [{"text": "My data", "href": "https://example.org"}]} adds yours, and dashboard={"credits": []} leaves out
the credits of your page. A base map that lists its sources gives its own rows after yours, and a row that names OpenStreetMap is not
shown twice. The blank base map lists no source, so the list shows the credit that the style's roads source carries ("Data from
OpenStreetMap") in place of your page's credit. The base map's credits follow. The list is short: a long list of image sources is left out.
The dark theme
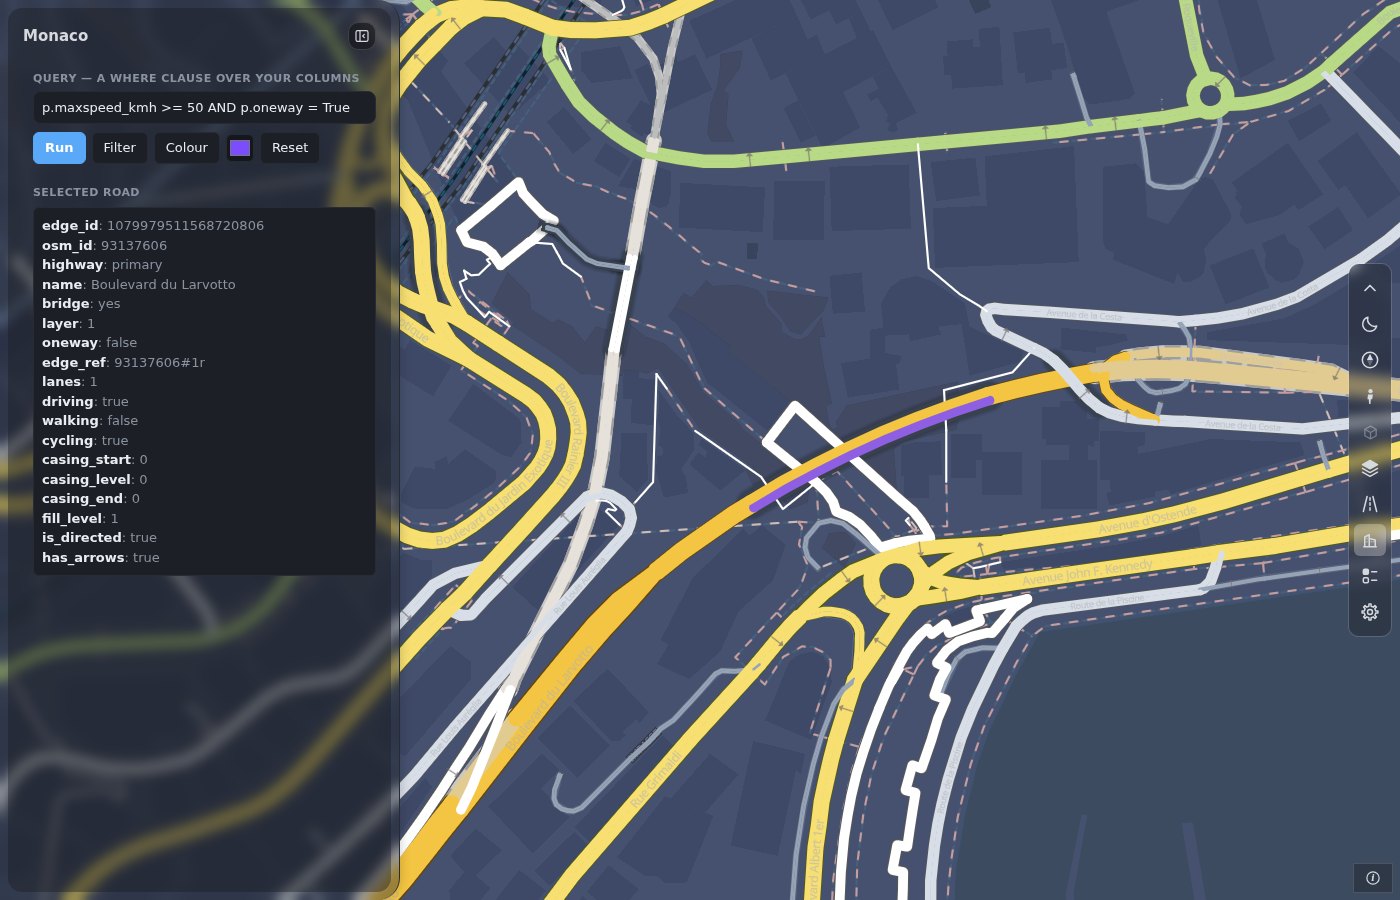
The theme button sets the light or the dark theme for the whole page: the bar, the panel, the boxes, the popup and the roads. A dark base map (OpenFreeMap Fiord or Dark, Esri
Dark Gray, Blank dark) sets the dark theme too. The style's own layers (land, parks, water, buildings, paved areas, lines and points of a duckOSM map, the casing of the roads, the names and the arrows) have a dark
colour in the style, and the global state rs_theme picks it. A change of theme needs no new style and no new tile. The dark colour is the light one turned by the dark block of the profile.
The fill of a road keeps its colour. Design: docs/design/dark_theme.md.
There is no theme= keyword. The page starts light. To start dark, use page_script="rs.ready(() => rsSetTheme('dark'))".
Add a tool
To add a tool of your own, use rs.tools:
To hold the bar until your tools are in, use dashboard={"toolbar": {"hold": True}} and call rs.tools.ready() (the bar shows after 6 s at most).
Your own sections: Add to the panel. Older script? Move a dashboard.
The windows
Street View and Google 3D open in the free part of the map and keep their size. The windows option sets their rules (keep inside the screen, restore, remember: Dashboard options). Google 3D has a view switch, Imagery or Map, and Follow is on at the start.
street_view="dock" docks Street View beside the map, as a side of the page with a divider that you drag. The window takes the right part of the screen (the lower part on a phone). The Street View button of the bar closes and opens it. A dashboard with dashboard={"panel": None} has no panel: the page is the map and the toolbox. See Street View.
When the window is small
The bar stays in the free part of the window. This is the part that the panel does not cover. When the bar does not fit in one line, it takes more lines. It never scrolls.
- A bar at the left or right edge that is too short for its tools takes a second column, and a third column when it must. The first column is at the edge.
- A bar at the top or the bottom is centered between the panel and the edge of the window. When this space is too narrow, the bar takes a second row.
- A box opens beside the whole bar, toward the map. It never opens over a second column or row, and it never goes under the bar. The credits box, which opens from the bottom corner, moves to the side of a bar that is in its way. A box that opens beside a bar at a side ends above the scale box and the credits button.
- Tools that you add with
rs.tools.addtake the same lines as the built-in tools.
The bar is tested down to a window height of 145 px. At this height, every tool is inside a bar at the left or right edge. A bar along the top and the credits box can overlap at a height of less than 160 px.
A phone
At 700 px or less, the page turns to its phone form by itself: the bar is at the top and the panel is a bottom sheet. This is true for a narrow desktop window too. There is no phone option.
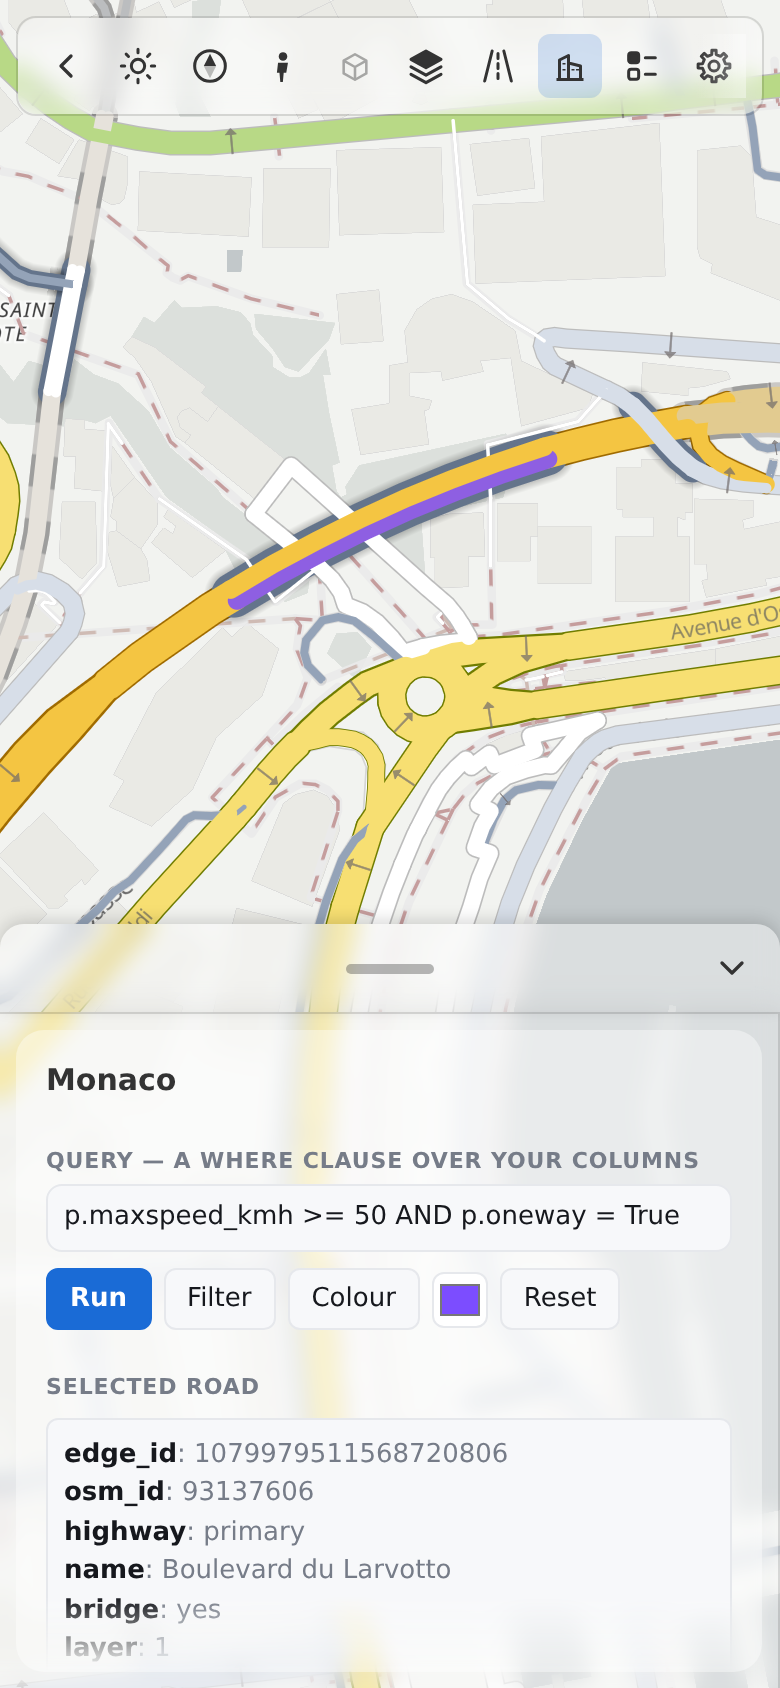
- The bar has the same tools as on a desktop, in one row. When the tools do not fit, the row moves sideways under a finger (it has no scrollbar). A soft fade at an edge shows that more tools are there. A box of the bar opens under the row, as a fixed box with the width of the window, so the scrolling row does not clip it.
- The fold button is first in the bar. It hides the bar, and one small button stays. A tap on that button opens the bar again. The page keeps
your choice in this browser (
rs-settings:toolbar-folded). - The sheet has three heights: closed, 40 % and full. Its grip is a strip of 44 px with an arrow. The arrow goes one height down, and up when the sheet is
closed. The grip and its line follow the theme. The sheet uses the height of the visible screen (
dvh), so the grip of the full sheet stays below the bar and you can lower the sheet. - The first view fits into the free part of the window: below the bar and above the sheet. On a desktop it fits beside the panel and the
bar. A page of your own can ask for these values with
rsFreePad()andrs.freeArea(), and it can set the sheet withrs.sheet(n). - A window (Street View, Google 3D) is a bottom sheet too. One sheet is open at a time. The bar of a window wraps, and the 3D note has its own row.
- A box of the bar stays inside the screen, also sideways.
The area boundary
boundary= (GeoJSON or a shapely geometry) is an input of the page: a dashed line shows it. boundary_dim=True shades the outside; boundary_limit=True keeps the camera near it. The boundary option sets the opacity of the shade and the limit (Dashboard options).
Style
The box in the bottom corner (scale, zoom number, credits) has the rounded shape of the bar. A button with a text shows no tooltip box, and a tooltip box never covers its control. On a phone every tool of the one-row bar can be reached: the row scrolls, and the first and the last tool are whole at the ends.
The accent color and the other tokens are the same in both themes. They are in Dashboard parts. The rules for each part: docs/design/dashboard_templates.md, 3.4.