roadstyle
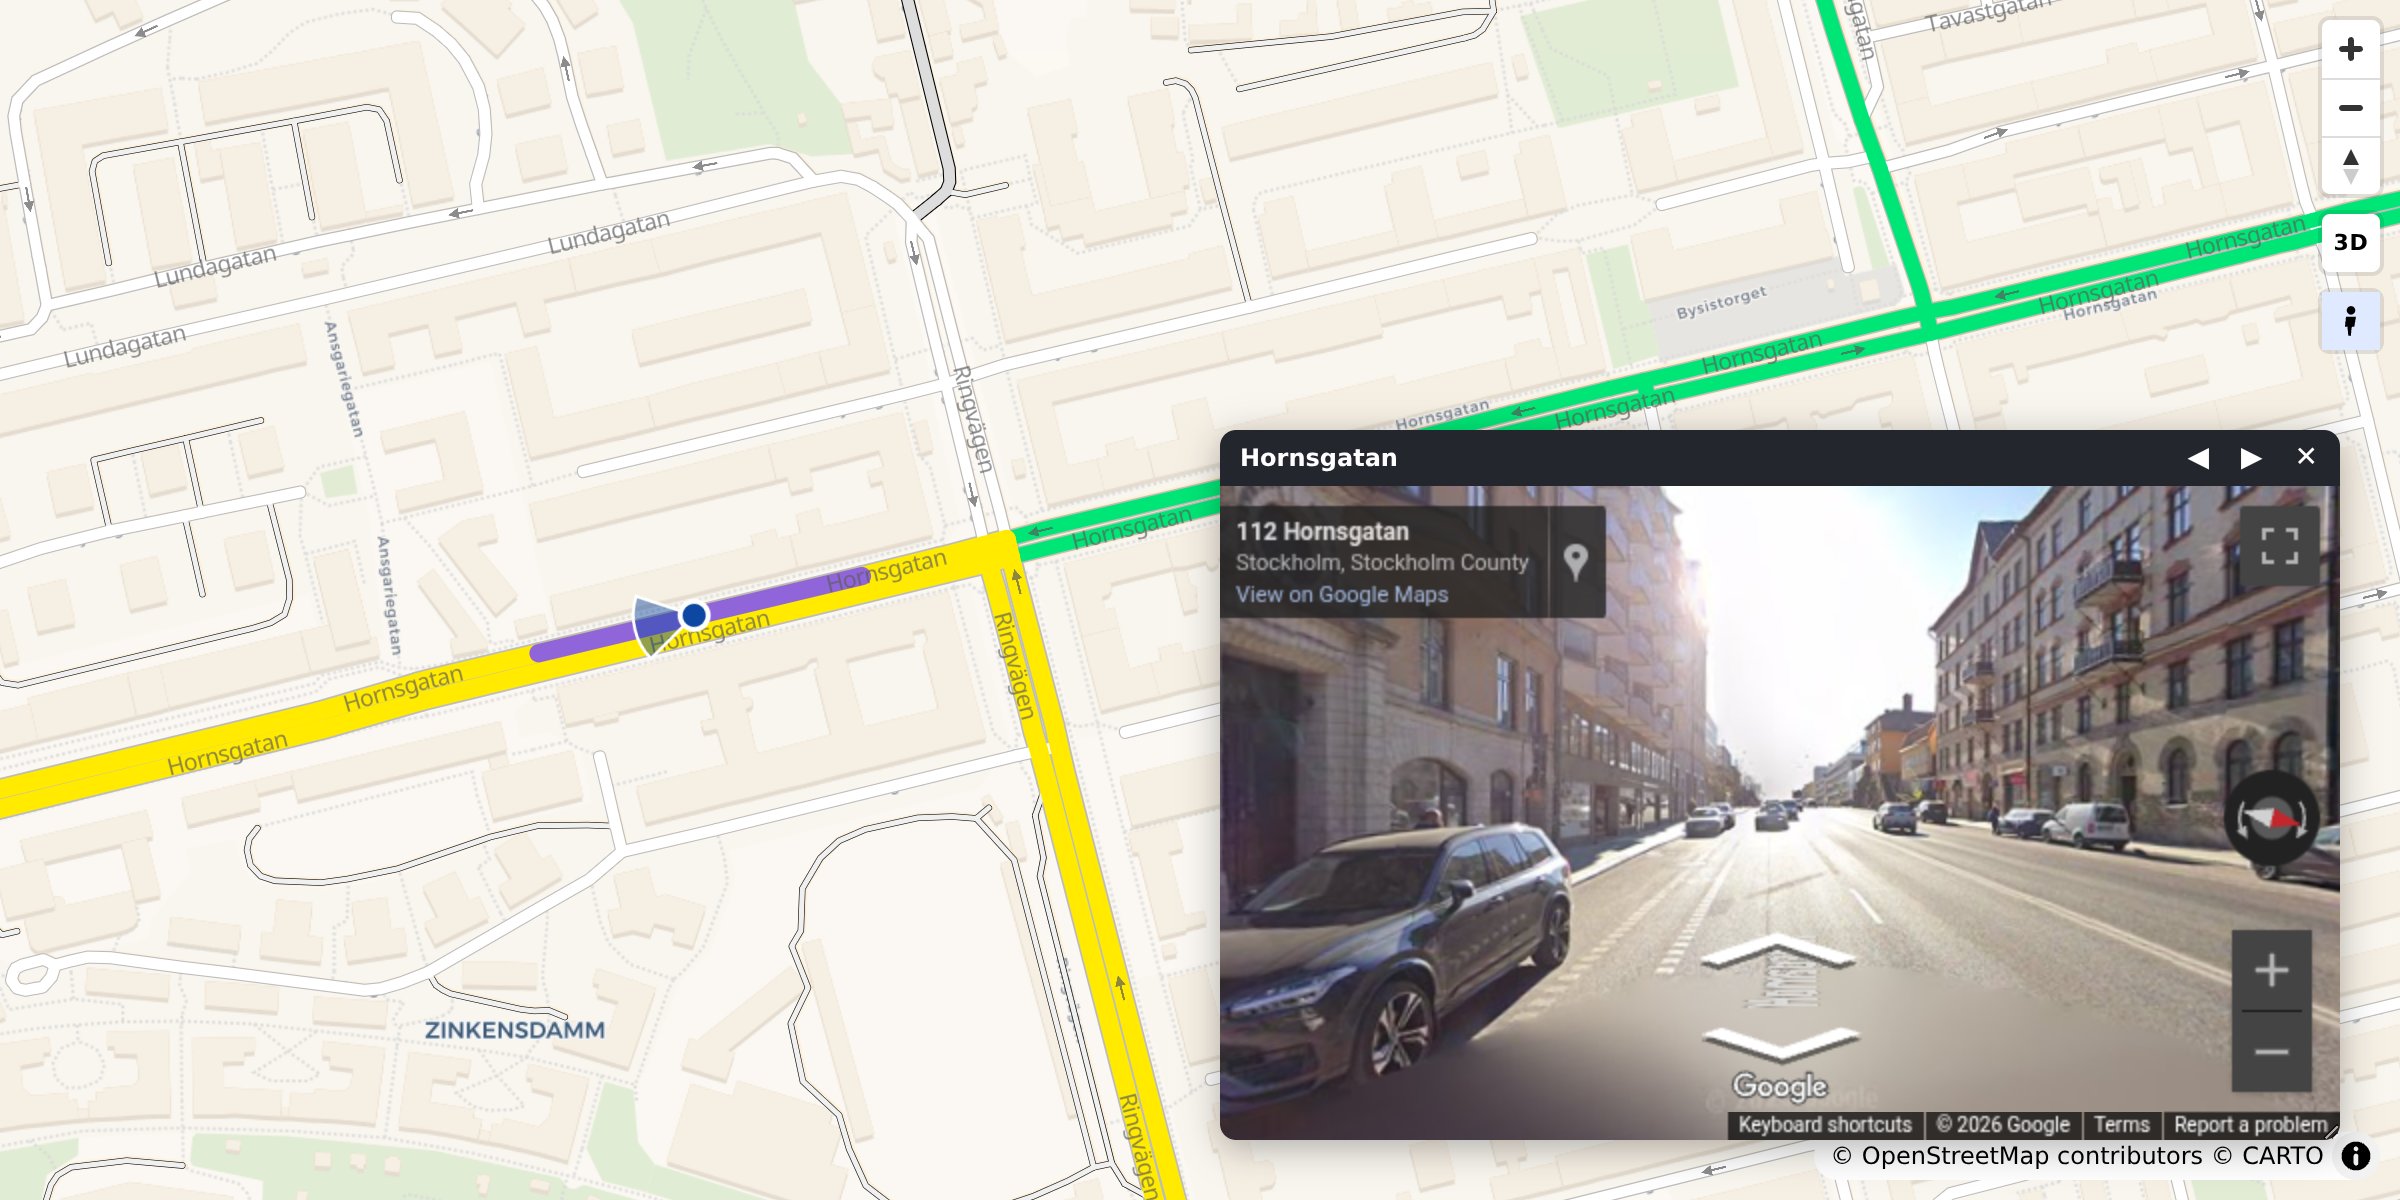
roadstyle turns a GeoDataFrame of road edges into a beautifully styled interactive map — an OSM-style "geometry sandwich" (coloured fills over casings) with palettes, settings, and base maps — and can colour roads by your own data, on folium / lonboard / a self-contained MapLibre (vector) backend, or as a stack-agnostic JSON spec you embed in any website.
import geopandas as gpd
from roadstyle import render_edges
edges = gpd.read_file("edges.gpkg") # any CRS; needs a road-class column
render_edges(edges, basemap="dark_matter").save("roads.html") # classic OSM styling
render_edges(edges, color_by="aadt", cmap="viridis", # colour by a data value
width_by=(1, 6), legend=True).save("traffic.html")
…or straight from the shell — no Python needed:
roadstyle edges.gpkg -o roads.html --basemap dark_matter
roadstyle edges.gpkg --color-by aadt --cmap viridis --width-by 1 6 # colour by your data
roadstyle studio # or click through it — the Streamlit workbench
Why roadstyle?
- Geometry sandwich — every road is a coloured fill over a wider casing, so junctions and overlaps read cleanly (just like the OSM "Standard" style).
- Class styling — built-in
highsat(high-saturation) andcarto(classic OSM) palettes; bring your own vocabulary withregister_palette/ palette JSON. - Data-driven styling — colour/size roads by any categorical column (
color_by+colors) or numeric column (color_by+cmap+width_by), with automatic legends. - Base maps — voyager / positron / dark matter / OSM / satellite, plus the tile-less
blankcanvas (zero network requests — fully offline), with an in-map switcher. - 3D view —
view_3d=True: tilted camera, extruded ramped bridge decks with black casing, an on-map 2D/3D toggle. - Scriptable — every control has a
window.rs*JavaScript twin, plus id-set queries (rsQuery→ filter / colour / highlight / table / fly-to) andrs:*events; copyable UI templates live inui/. - One settings file — every styling default in
data/defaults.json, overridable viaroadstyle.json,rs.use_settings(...), or a per-callsettings=. - Backends + web output — folium (portable HTML), lonboard (WebGL), a self-contained
MapLibre
webbackend (per-zoom widths, two-way lanes, arrows/names, hover/select, tunnel/bridge grade separation — offline, no server; see web backend), andto_spec/to_html/to_iframefor embedding in your own site (Leaflet / MapLibre / iframe). - Switchable colouring — bake several "colour by" options with
color_optionsand switch between them in the browser (a Colour by dropdown), no re-render; blank edges keep the base colour. - Overlay layers — bring your own geometry (zones, POIs, any lines) as
Overlays, drawn under/over the roads, clickable, with a Layers toggle. - Canonical input —
normalize_edgesreprojects, drops non-lines, and maps your column names. - Command line — the
roadstyleCLI renders any road file from the shell, no Python required.
Where to next
- Gallery — one screenshot + recipe per look.
- Manual — a hands-on walk-through with the live map embedded after each step.
- Usage — install, the command line, quick start, recipes.
- Choosing an engine — web vs folium vs lonboard vs roadstyle.js, with a feature matrix.
- Parameter reference — every parameter explained.
- MapLibre web backend — the self-contained, zoom-correct vector map (two-way lanes, grade separation, offline).
- Embedding in a website — the JSON spec + Leaflet/MapLibre/iframe snippets.
- Palettes — styling + settings reference.
- Comparison — roadstyle vs geopandas
.explore()/ prettymaps.