Skip to content

Studio (Streamlit workbench)

roadstyle studio is the gentlest way to work with — and demo — the library: point it at a road file, click through the knobs, and watch the live map update next to the exact render_edges code that produces it. Every page has a download button for the self-contained HTML.

pip install "roadstyle[studio]"   # adds streamlit; sample networks (~12 MB) download on first run
roadstyle studio                  # forwards streamlit args, e.g. roadstyle studio --server.port 8502

The map itself is plain roadstyle; Streamlit only draws the knobs. No clone needed — the studio ships inside the package, and roadstyle studio is a thin wrapper over streamlit run, so any Streamlit flag (--server.port, --server.address, …) is forwarded. It opens on the Map page and carries a page switcher for three products — Map, Dashboard, Report.

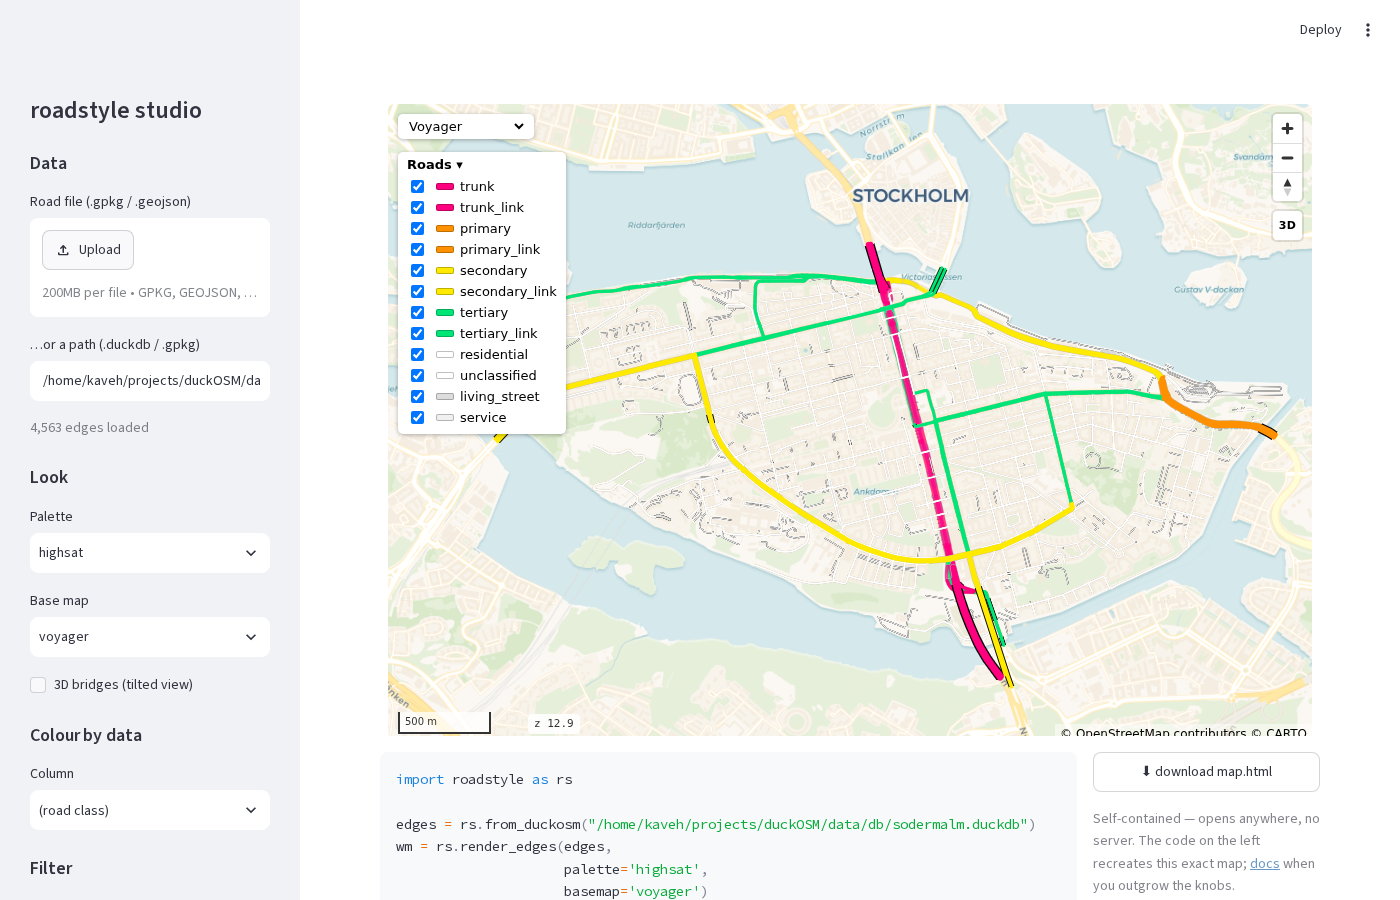
roadstyle studio — knobs on the left, the live map and the exact render_edges code on the right

Map

The whole library behind a few knobs. Load a road file (or a bundled Södermalm sample), then set:

  • Look — palette, base map, 3D bridges (tilted view), and vector tiles (embedded PMTiles for big networks, when the tiles extra is installed).
  • Colour by data — recolour by any column with a colormap.
  • Filter — keep a subset of road classes; hide minor classes when zoomed out (minzoom).
  • Decorations — street-name labels, one-way arrows.
  • Popup & hover — the click popup (curated / chosen columns / side panel / all / off) and a hover tooltip.
  • Overlays — bring zones / POIs / lines as extra layers.

The live map sits beside the exact render_edges(...) call for the current state — copy it out when you outgrow the knobs, or download map.html.

Dashboard

The same knobs, but the product is the query sidebar (ui/dashboard): the map rendered with the built-in controls off and the sidebar injected — a query box, filter / colour buttons, a results table, and a detail panel, all driven through the public window.rs* API. Pick the base maps, colour-by columns and hover tooltip, preview it live, and download dashboard.html. The generated code is a single call — rs.render_dashboard(edges, ...) — which ships with the library, so the page needs no repo checkout to rebuild.

Report

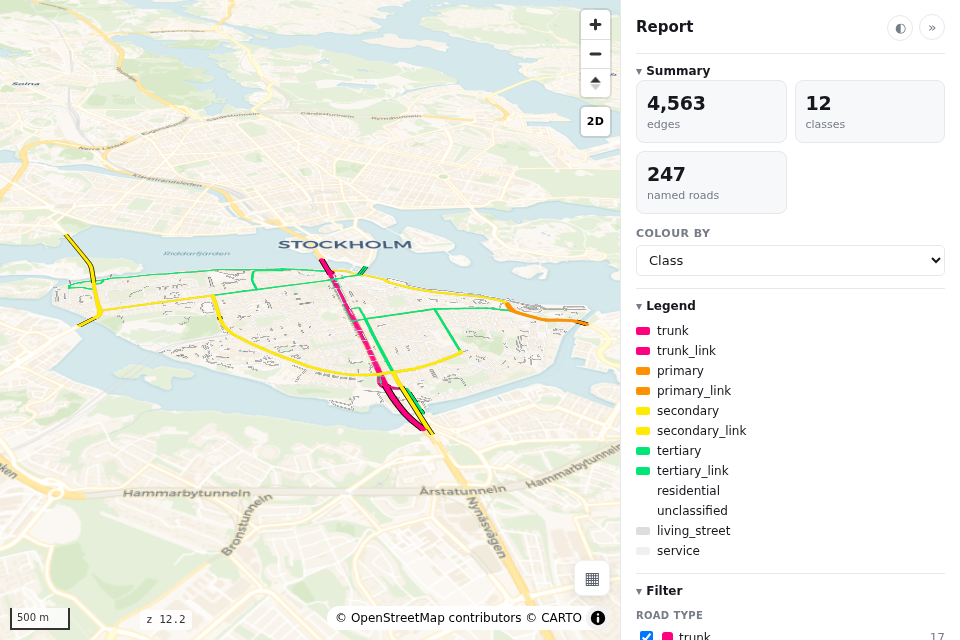
The same again, but the product is the report sidebar (ui/report): KPI cards (edges / classes / named roads / length), the active colour-by legend, a checkbox filter (overlay layers + road types), a search box, and a selected-road read-out — a stats-forward panel whose every number is computed client-side from the baked edges. The base map keeps the map's on-map switcher icon. Download report.html, or reproduce it with the shipped rs.render_report(edges, ...).

The report sidebar — KPI cards, colour-by legend, and a layer / road-type filter over a live map

The sidebar pages are authoring tools

Dashboard and Report just pick the knobs and call the shipped render_dashboard / render_report, which inject a bundled sidebar template; the HTML / CSS / JS fragment (rs.sidebar_html(...), also in ui/) is yours to reshape. Everything the sidebars do goes through the documented window.rs* API.