Gallery
One look per entry: the keywords that make it, and a real screenshot.
Every entry uses the bundled Södermalm sample:
import geopandas as gpd
import roadstyle as rs
edges = gpd.read_file("ui/studio/samples/sodermalm_driving.geojson")
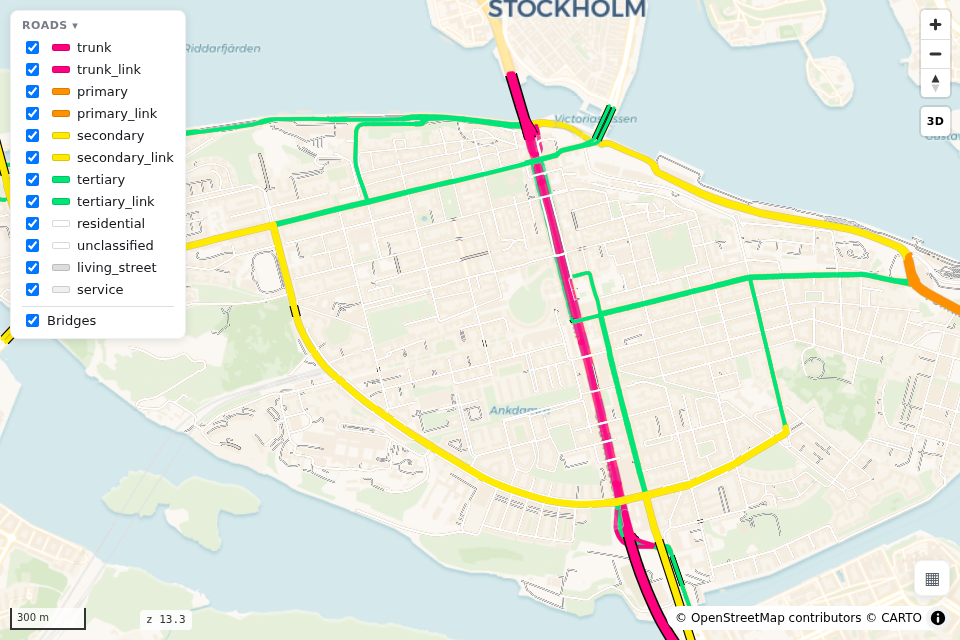
The defaults
rs.render_edges(edges) # highsat palette on Voyager
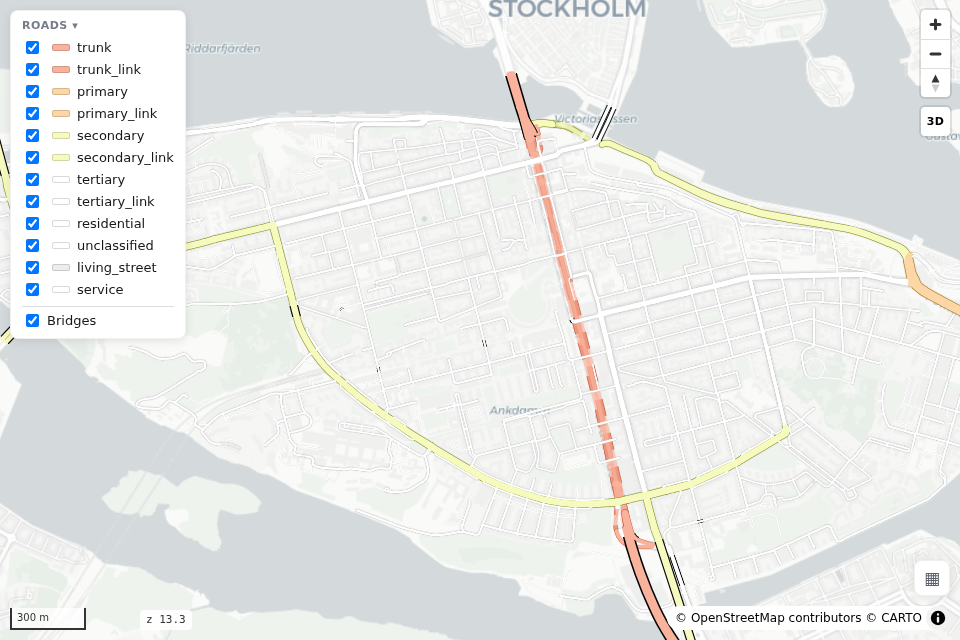
OSM-Carto on Positron
rs.render_edges(edges, palette="carto", basemap="positron")
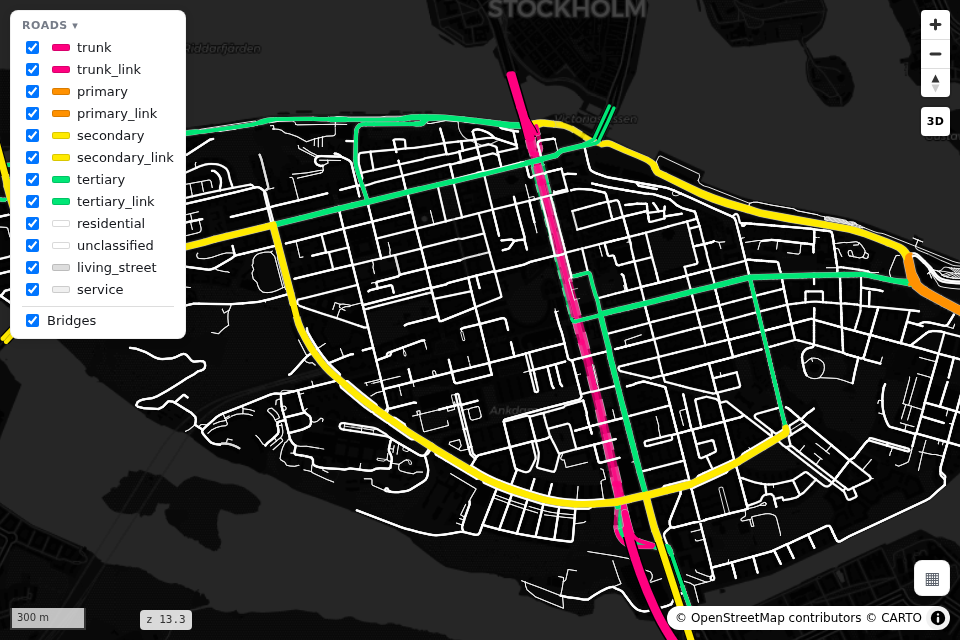
Dark
rs.render_edges(edges, basemap="dark_matter")
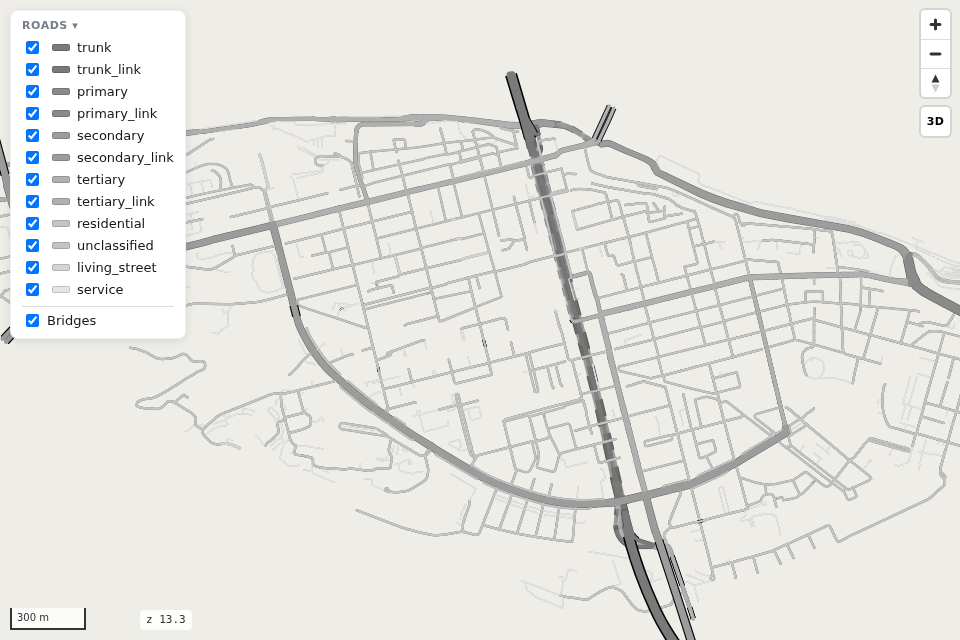
Blank canvas (offline)
rs.render_edges(edges, palette="mono", basemap="blank", basemap_switcher=False)
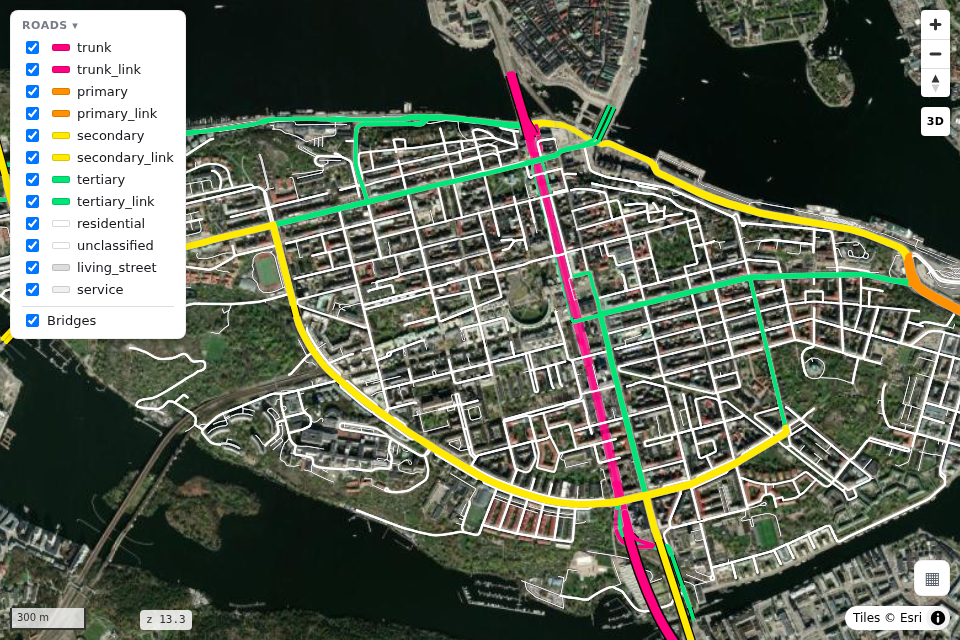
Satellite
rs.render_edges(edges, basemap="satellite")
Colour by data
rs.render_edges(edges, color_by="maxspeed_kmh", cmap="plasma", basemap="positron")
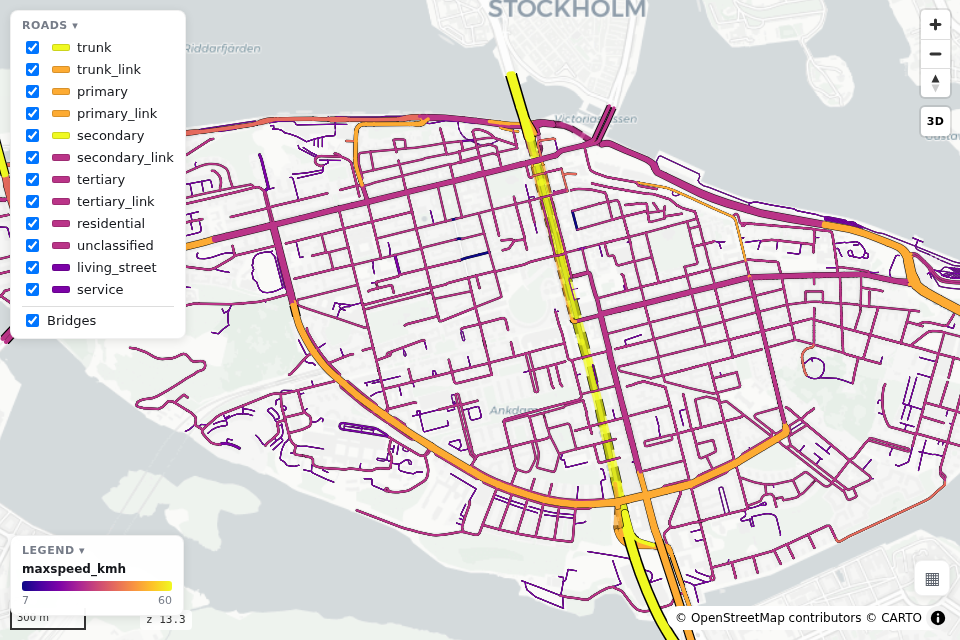
More in Colour by your data.
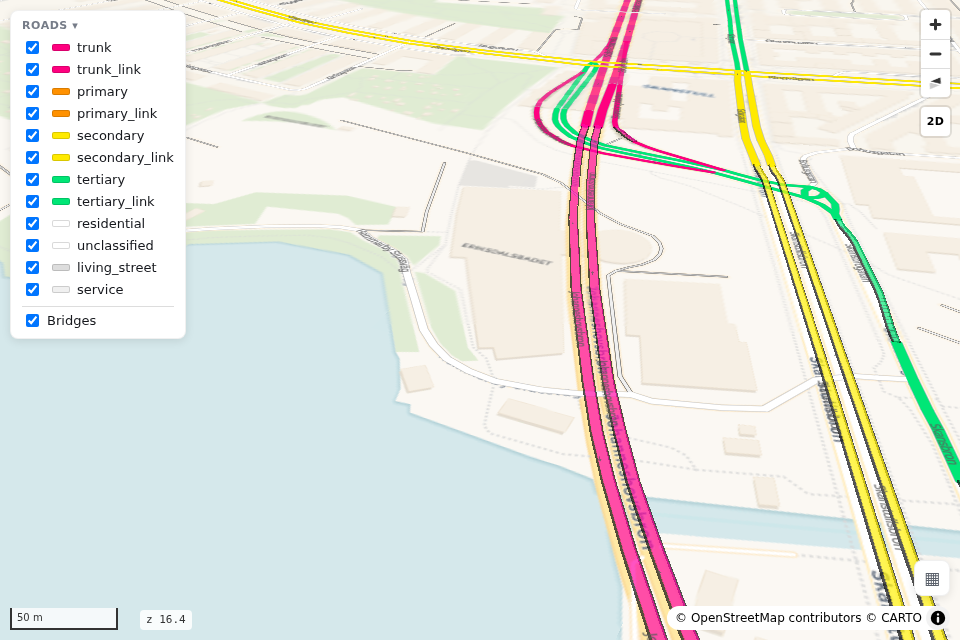
3D bridges
rs.render_edges(edges, view_3d=True)
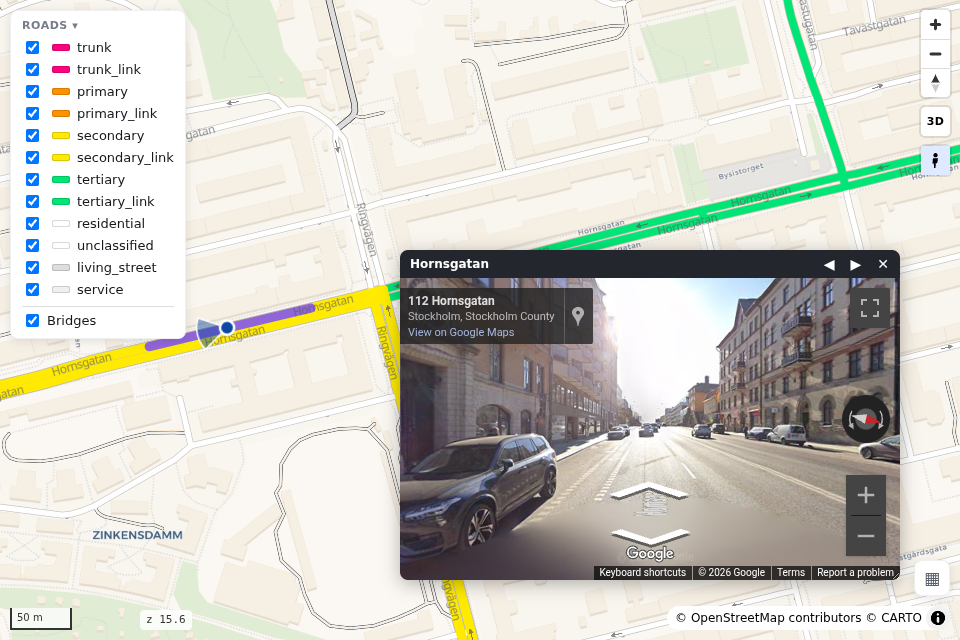
Street View window
rs.render_edges(edges) # the Street View button is on by default
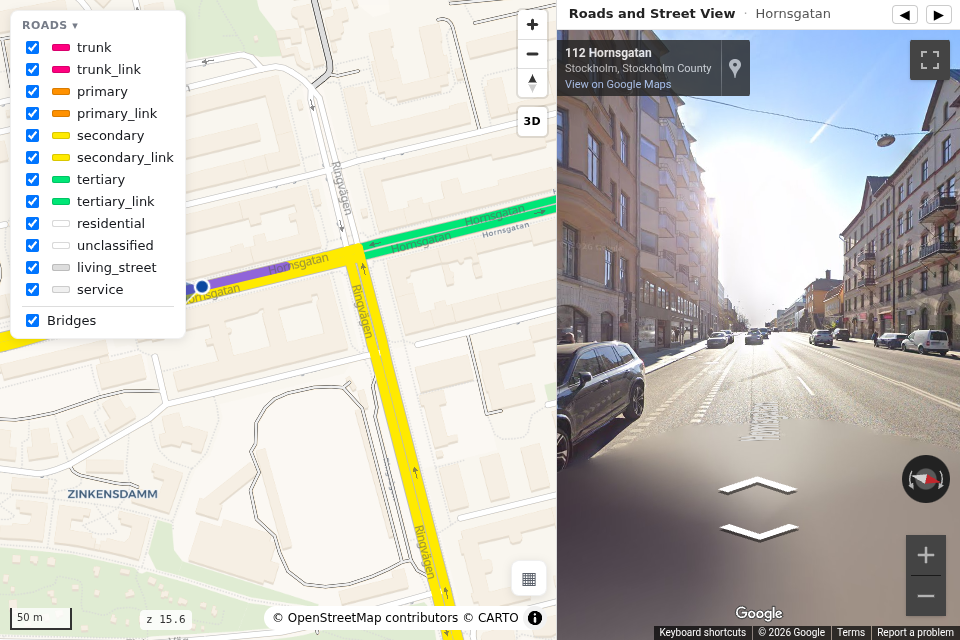
Street View beside the map
rs.render_street_view(edges) # CLI: roadstyle edges.gpkg --page street-view
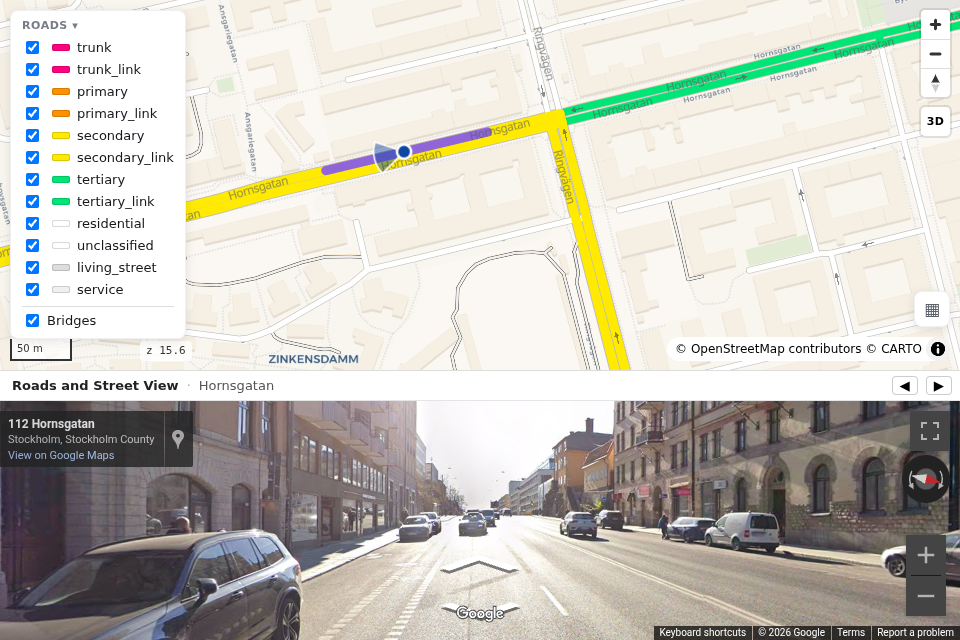
Street View below the map
rs.render_street_view(edges, layout="below")
More in Google Street View.
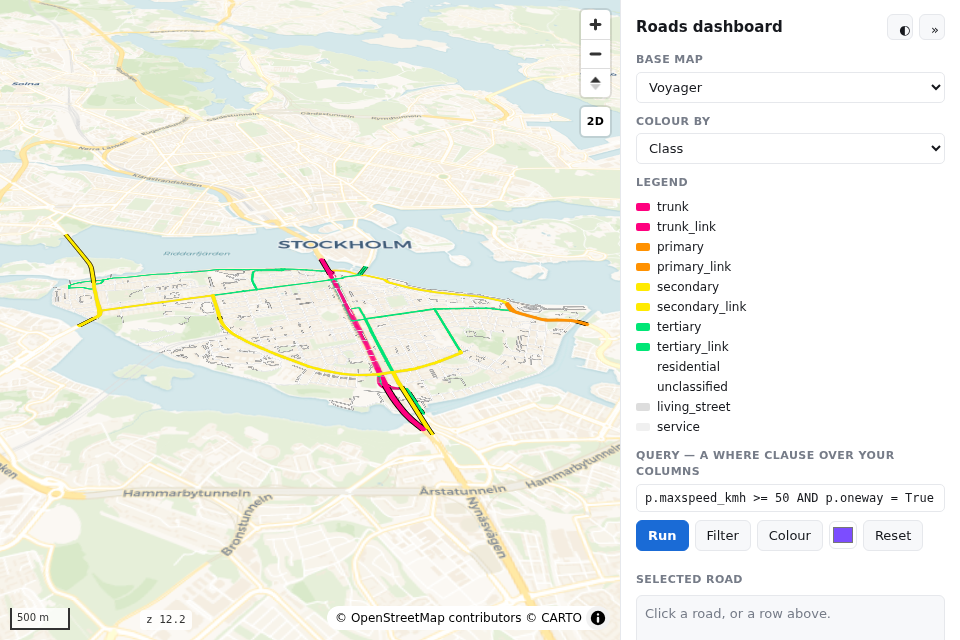
Dashboard
rs.render_dashboard(edges).save("dashboard.html") # CLI: --page dashboard
More in Dashboards & JavaScript.
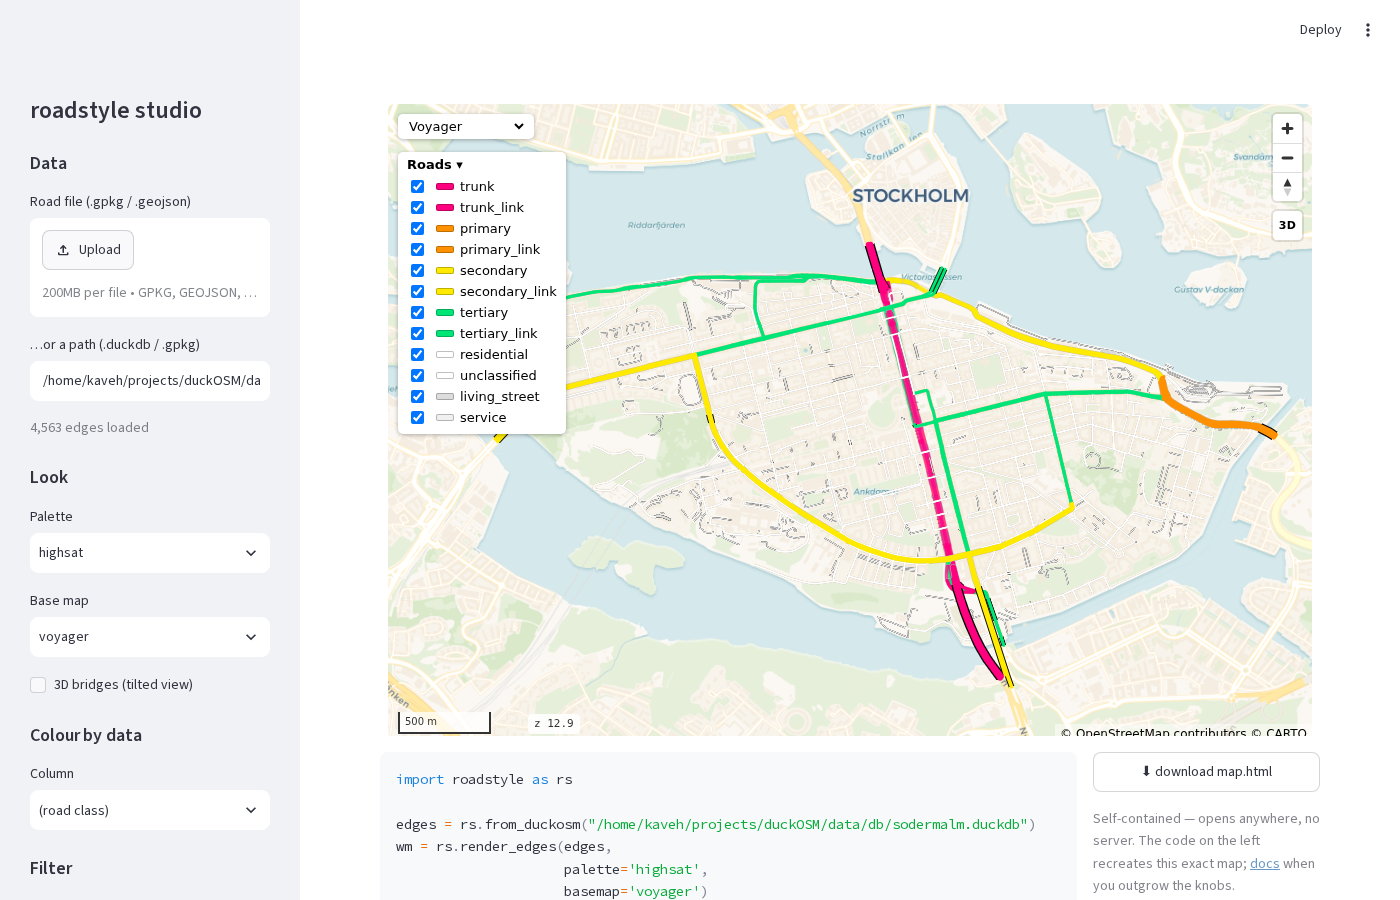
Studio
pip install "roadstyle[studio]" && roadstyle studio
More in Studio.