Dashboards & JavaScript
Get a finished dashboard or report page in one call, or put your own panel next to the map and drive it from JavaScript.
Ready-made pages
| call | sidebar |
|---|---|
rs.render_dashboard |
base-map and colour selects, a class filter, a query box with a results table, a selected-road read-out |
rs.render_report |
headline numbers, the colour legend, a layer and class filter, search, a selected-road read-out |
rs.render_street_view |
Google Street View beside or below the map (Google Street View) |
Each takes every render_edges keyword and returns the same map object (.save(), .html).
color_options fills the Colour by picker; name= sets the page title.
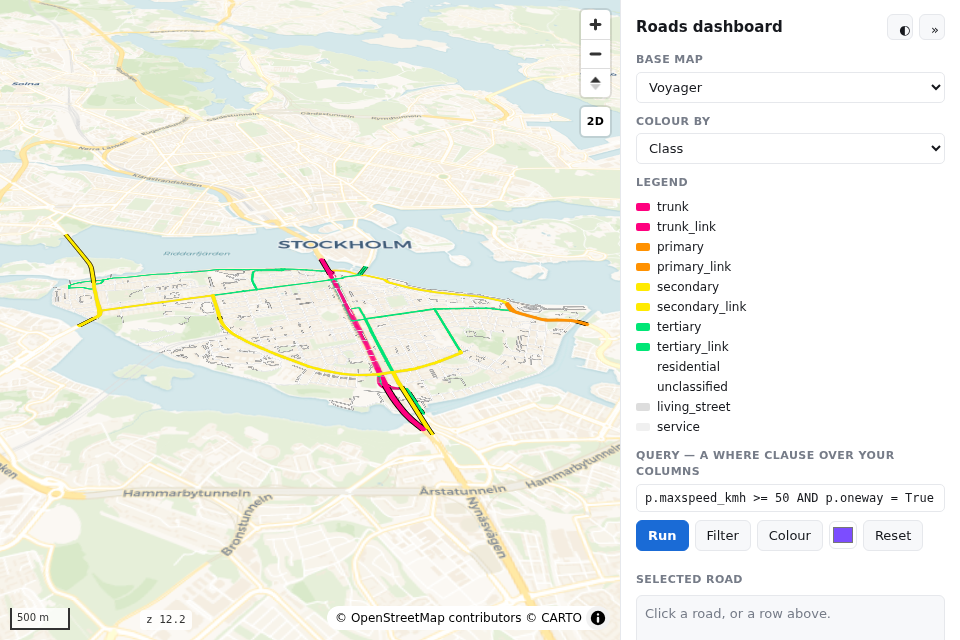
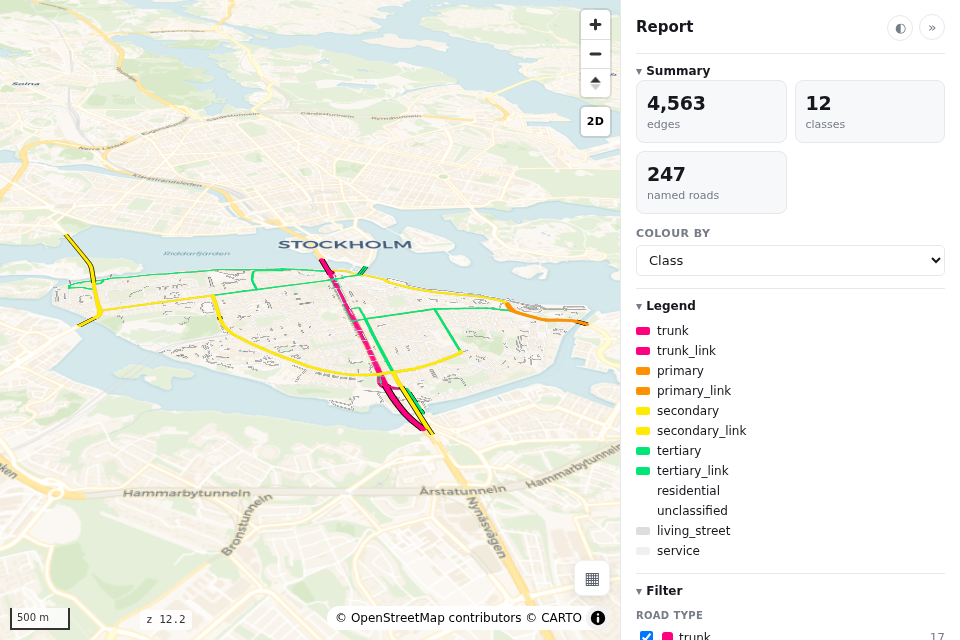
To reshape a sidebar, rs.sidebar_html("dashboard") (or "report") returns its HTML. Edit it
and insert it before </body> of a plain render_edges map.
Drive the map from your own page
m.html is the saved page as a string. Put your panel before </body> and talk to the map
through the window.rs* functions:
m = rs.render_edges(edges, palette="mono")
panel = """
<div id="side" style="position:fixed;top:0;right:0;bottom:0;width:400px;background:#fff"></div>
<style>#map{right:400px!important} body{--rs-side:400px}</style>
<script>
map.once("load", () => {                  // the roads are queryable once the map loads
  const ids = rsQuery(p => p.name === "Götgatan");
  rsColor(ids, "#e63946"); rsFocus(ids);
});
document.addEventListener("rs:select", e => {
  document.getElementById("side").textContent = JSON.stringify(e.detail.properties);
});
</script>"""
open("host.html", "w").write(m.html.replace("</body>", panel + "</body>"))
| call | does |
|---|---|
rsQuery(p => bool) |
the ids of the edges whose columns match |
rsColor(ids, "#hex") / rsColor(null) |
paint those edges / reset |
rsHighlight(ids) |
selection glow ([] clears) |
rsFocus(ids) |
fit the camera to them |
rsSelect(id) |
select one edge, like a click |
rs:select event |
e.detail.properties is the clicked edge's row; e.detail.streetView a Street View link facing its direction, or null |
Two traps
- Ids past 253.**
rsSelect,rsColorandrsFocustake roadstyle's ids, not youredge_id. Find them withrsQuery(p => String(p.edge_id) === "8121729169906061189"). - A fixed side panel covers the map. Inset it:
#map{right:400px!important}
  body{--rs-side:400px}
. The map's controls, the base-map button among them, move with it.
To show a set of edges, recolour them with rsColor; don't draw extra lines over the roads.
Pick a highlight colour that no color_options entry already uses.
See also: JavaScript API · Command line · Every parameter